
The proof, published and verified
To our knowledge, Healthleap is the only commercially available, peer-reviewed AI malnutrition screening tool. The published study evaluated an AI-based hospital malnutrition screening model using EHR data from 106,449 patients over 3.75 years. Hospital deployment and financial results are labeled separately.
The headline numbers
- $23.8M
Annualized financial impact at one site (Penn Medicine HUP).
- 88%
Higher sensitivity than the modified Malnutrition Screening Tool (MST).
- 39%
More malnutrition diagnoses at the same staffing (Cedars-Sinai).
- 2:1
Contractual ROI floor on hard reimbursement.
Peer-reviewed validation study
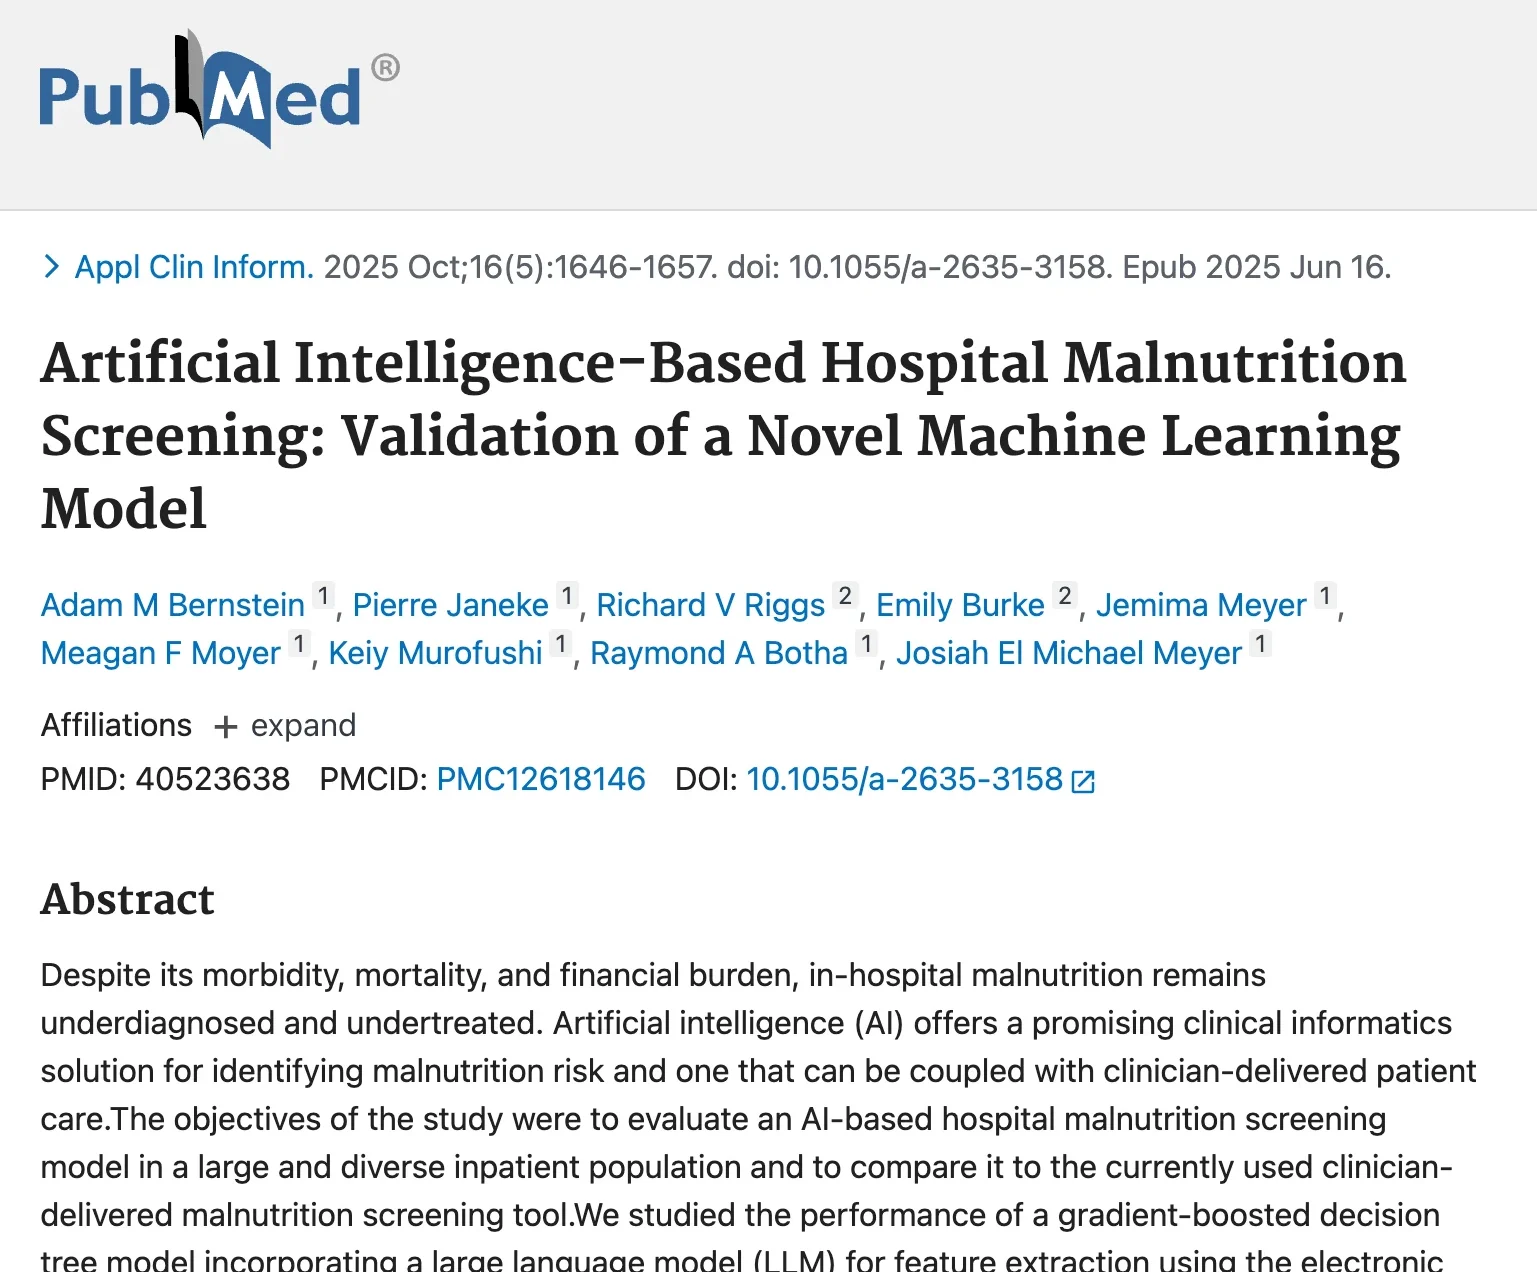
Bernstein et al., Applied Clinical Informatics, 2025. The model was studied across 166,000+ admissions from 106,000+ patients over 3.75 years, and validated against dietitian documentation and discharge coding, the clinical reference standard for malnutrition.
- Area under the ROC curve (AUROC), a standard measure of how well a model separates cases from non-cases: 0.92 on day one, 0.95 across the stay.
- 88% higher sensitivity than the modified MST.
- Patients identified a mean of 4 days before first dietitian documentation.
- Checked for bias by race and sex.
Financial evidence
Penn Medicine
$23.8M
Annualized financial impact at a single site.
$23.8M annualized impact at one site: $6.3M in reimbursement lift, plus $17.5M in length-of-stay impact from 8,632 annualized bed-days saved. Validated internally by Penn Medicine's Strategic Decision Support team.
Source: Penn Medicine HUP Case Study, updated August 2026.
Cedars-Sinai
$11M
Annual impact.
$11M in annual impact from hard reimbursement and cost savings.
Source: Cedars-Sinai deployment outcomes.
Read the full HUP case study
Review the first-quarter methodology, implementation timeline, patient stories, and the analysis behind $23.8M in annualized impact.
Downside protection
2:1 contractual ROI floor on hard reimbursement. If the program does not pay for itself in incremental reimbursement, Healthleap pays back the difference.
Clinical outcomes
Cedars-Sinai
39% more malnutrition diagnoses at the same staffing. 1.1-day length-of-stay reduction for patients with malnutrition.
Penn Medicine
21% year-over-year increase in malnutrition diagnoses. 13% (1.69-day) risk-adjusted length-of-stay improvement for Healthleap-first patients, with 8,632 bed-days saved annualized.
Quality outcomes
Accepted for presentation at the Vizient Connections Summit (September 2026), Penn Medicine's analysis reported improvements in risk-adjusted length-of-stay outcomes (observed-to-expected, or O/E) for flagged patients: 18.5% across all flagged patients, and 22.6% for patients whose malnutrition was present on admission.
How the evidence was built
We hold Healthleap to the clinical standard, not to its own scorecard. The model is measured against what dietitians actually documented and how cases were coded at discharge, not against a made-up benchmark. The published study reports accuracy across the full stay, not just the easy day-one cases, and checks whether the model performs evenly across race and sex. Financial results are reviewed by each health system's own finance team before we report them.
Who stands behind it
- The Academy of Nutrition and Dietetics; their Chief Science Officer advises Healthleap.
- Richard Riggs, MD, former Chief Medical Officer of Cedars-Sinai.
- Cedars-Sinai, Emory, Houston Methodist, Intermountain, Northeast Georgia, Penn Medicine, and UMass Memorial.
- Sequoia Capital and First Round Capital.
- SOC 2 Type II. HIPAA-compliant. AWS infrastructure.
Questions about the evidence
What did the peer-reviewed validation study evaluate?
Bernstein et al. evaluated an AI-based hospital malnutrition screening model using EHR data from 106,449 patients over 3.75 years. The retrospective study compared model performance with discharge-coded malnutrition and dietitian-recorded malnutrition, and with the nurse-administered modified Malnutrition Screening Tool used in practice.
What accuracy did the study report?
The study reported an area under the receiver operating characteristic curve (AUROC) of 0.92 on the first day of hospitalization and 0.95 using each patient's maximum predicted risk during the hospital stay, measured against discharge-coded malnutrition. AUROC measures how well a model distinguishes cases from non-cases; these values are not percentages of patients correctly diagnosed.
Are hospital financial and deployment results peer-reviewed?
The evidence grade beside each result identifies its source. Peer-reviewed refers to the published clinical validation study. Finance-validated refers to hospital financial analyses, while deployment outcomes and accepted abstracts are labeled separately. Those results should not be treated as findings from the peer-reviewed model-validation study.
Will every hospital achieve the same results?
No. Performance and outcomes depend on the population, available EHR data, configuration, and local workflows. Published results reflect particular studies and deployments. Hospitals should evaluate the tool in their own environment; the results are not a guarantee of accuracy, reimbursement, or clinical outcomes at another institution.
The strongest evidence is your own.
Run a retrospective on your historical inpatient data to see how many patients manual screening missed, and what earlier identification would have been worth. Execute the Business Associate Agreement (BAA) the same day, have one IT person run a pre-built query, and review the results with your finance, clinical, and informatics leaders in about two weeks.